From install to your first finding
Install the CLI, let it set up your agents, then look at what they do in the local dashboard, the hosted one, or both. The terminals below show real output from the current release.
Step 1
Install
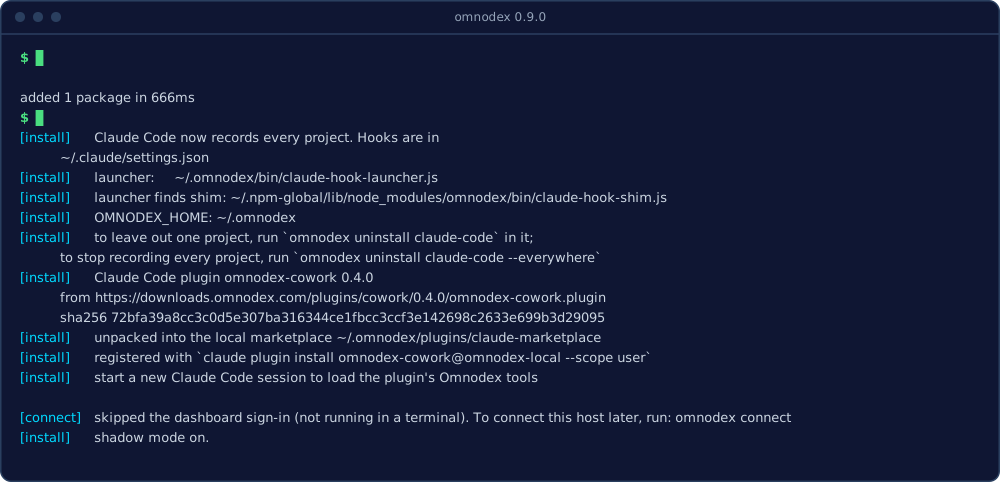
Install Omnodex from npm, then install it for your agent. Here that is Claude Code; omnodex install
on its own finds every supported agent on the machine, shows what it will write and asks once. The first install
turns on shadow mode, so each finding also says whether Omnodex would have stopped the call.
Step 2, on your machine
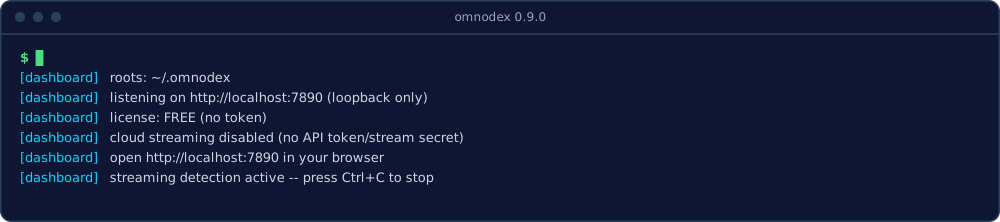
Open the local dashboard
Included in every plan, with no account. It listens only on your own machine and updates as your agents work.

Step 2, from anywhere
Connect the hosted dashboard
On a Hosted plan or above. Your events are encrypted on your machine before they leave it, and the dashboard decrypts them in your browser.
-
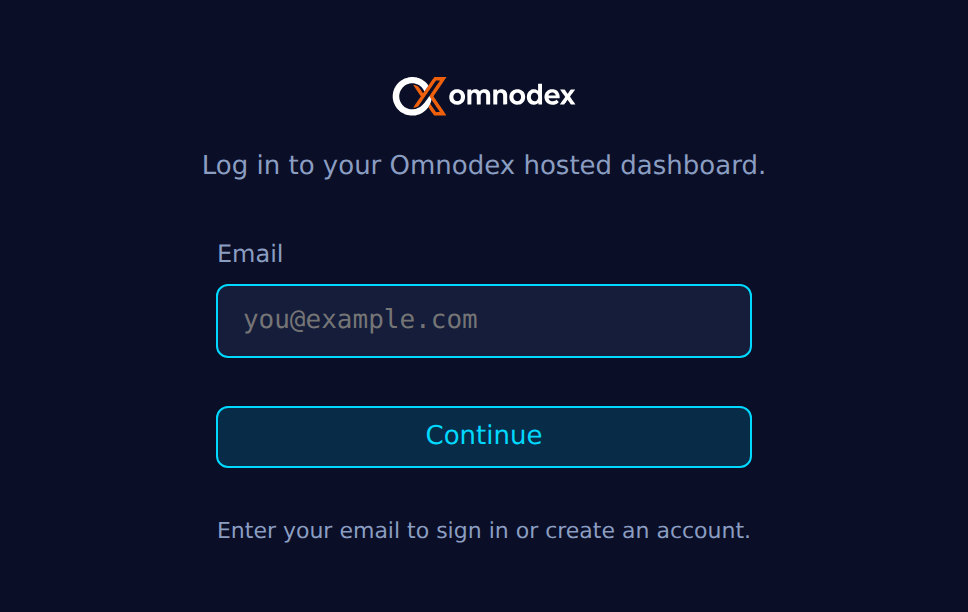
1. Create an account
At dashboard.omnodex.com, enter your email to sign in or create an account, and choose a plan.
-
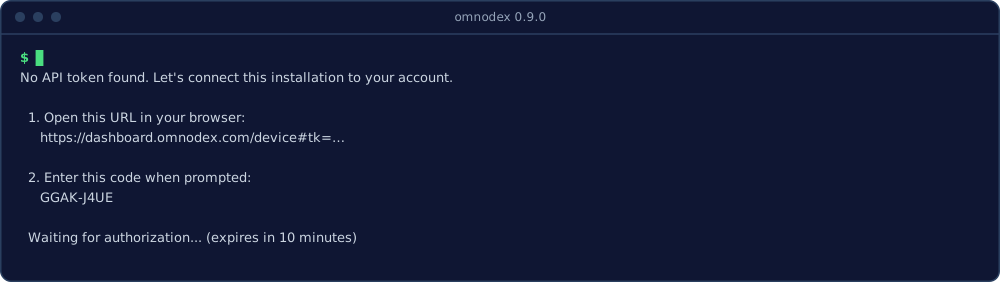
2. Run omnodex connect
It prints a one-time link and a code, then waits for you to approve this machine. The secret part of the link is shortened here.
-
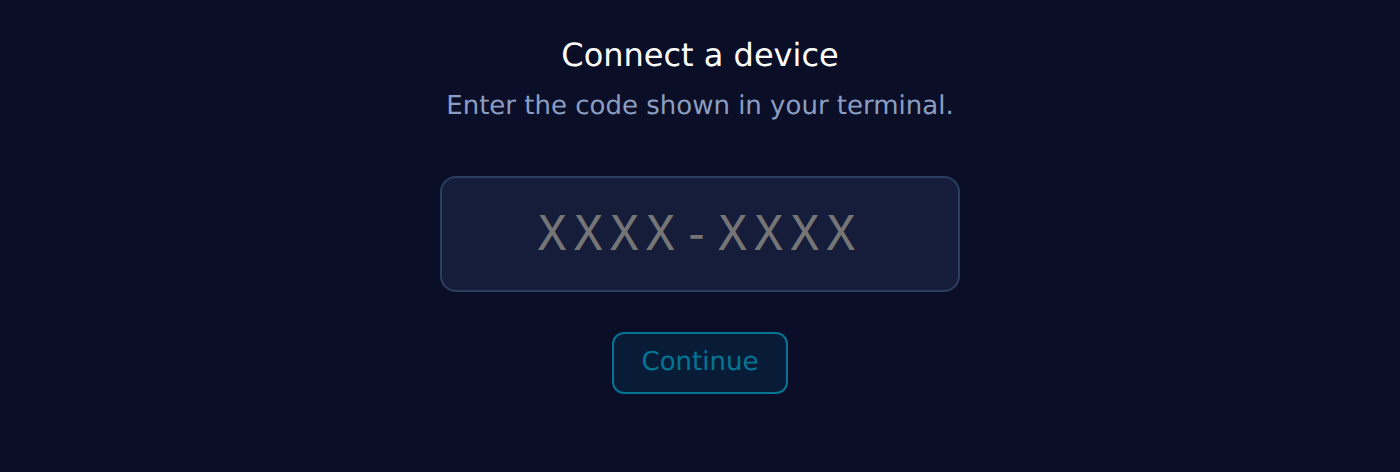
3. Approve it in the browser
Open the link, enter the code from your terminal, and the machine joins your account as a stream. Its data appears as it syncs.
-
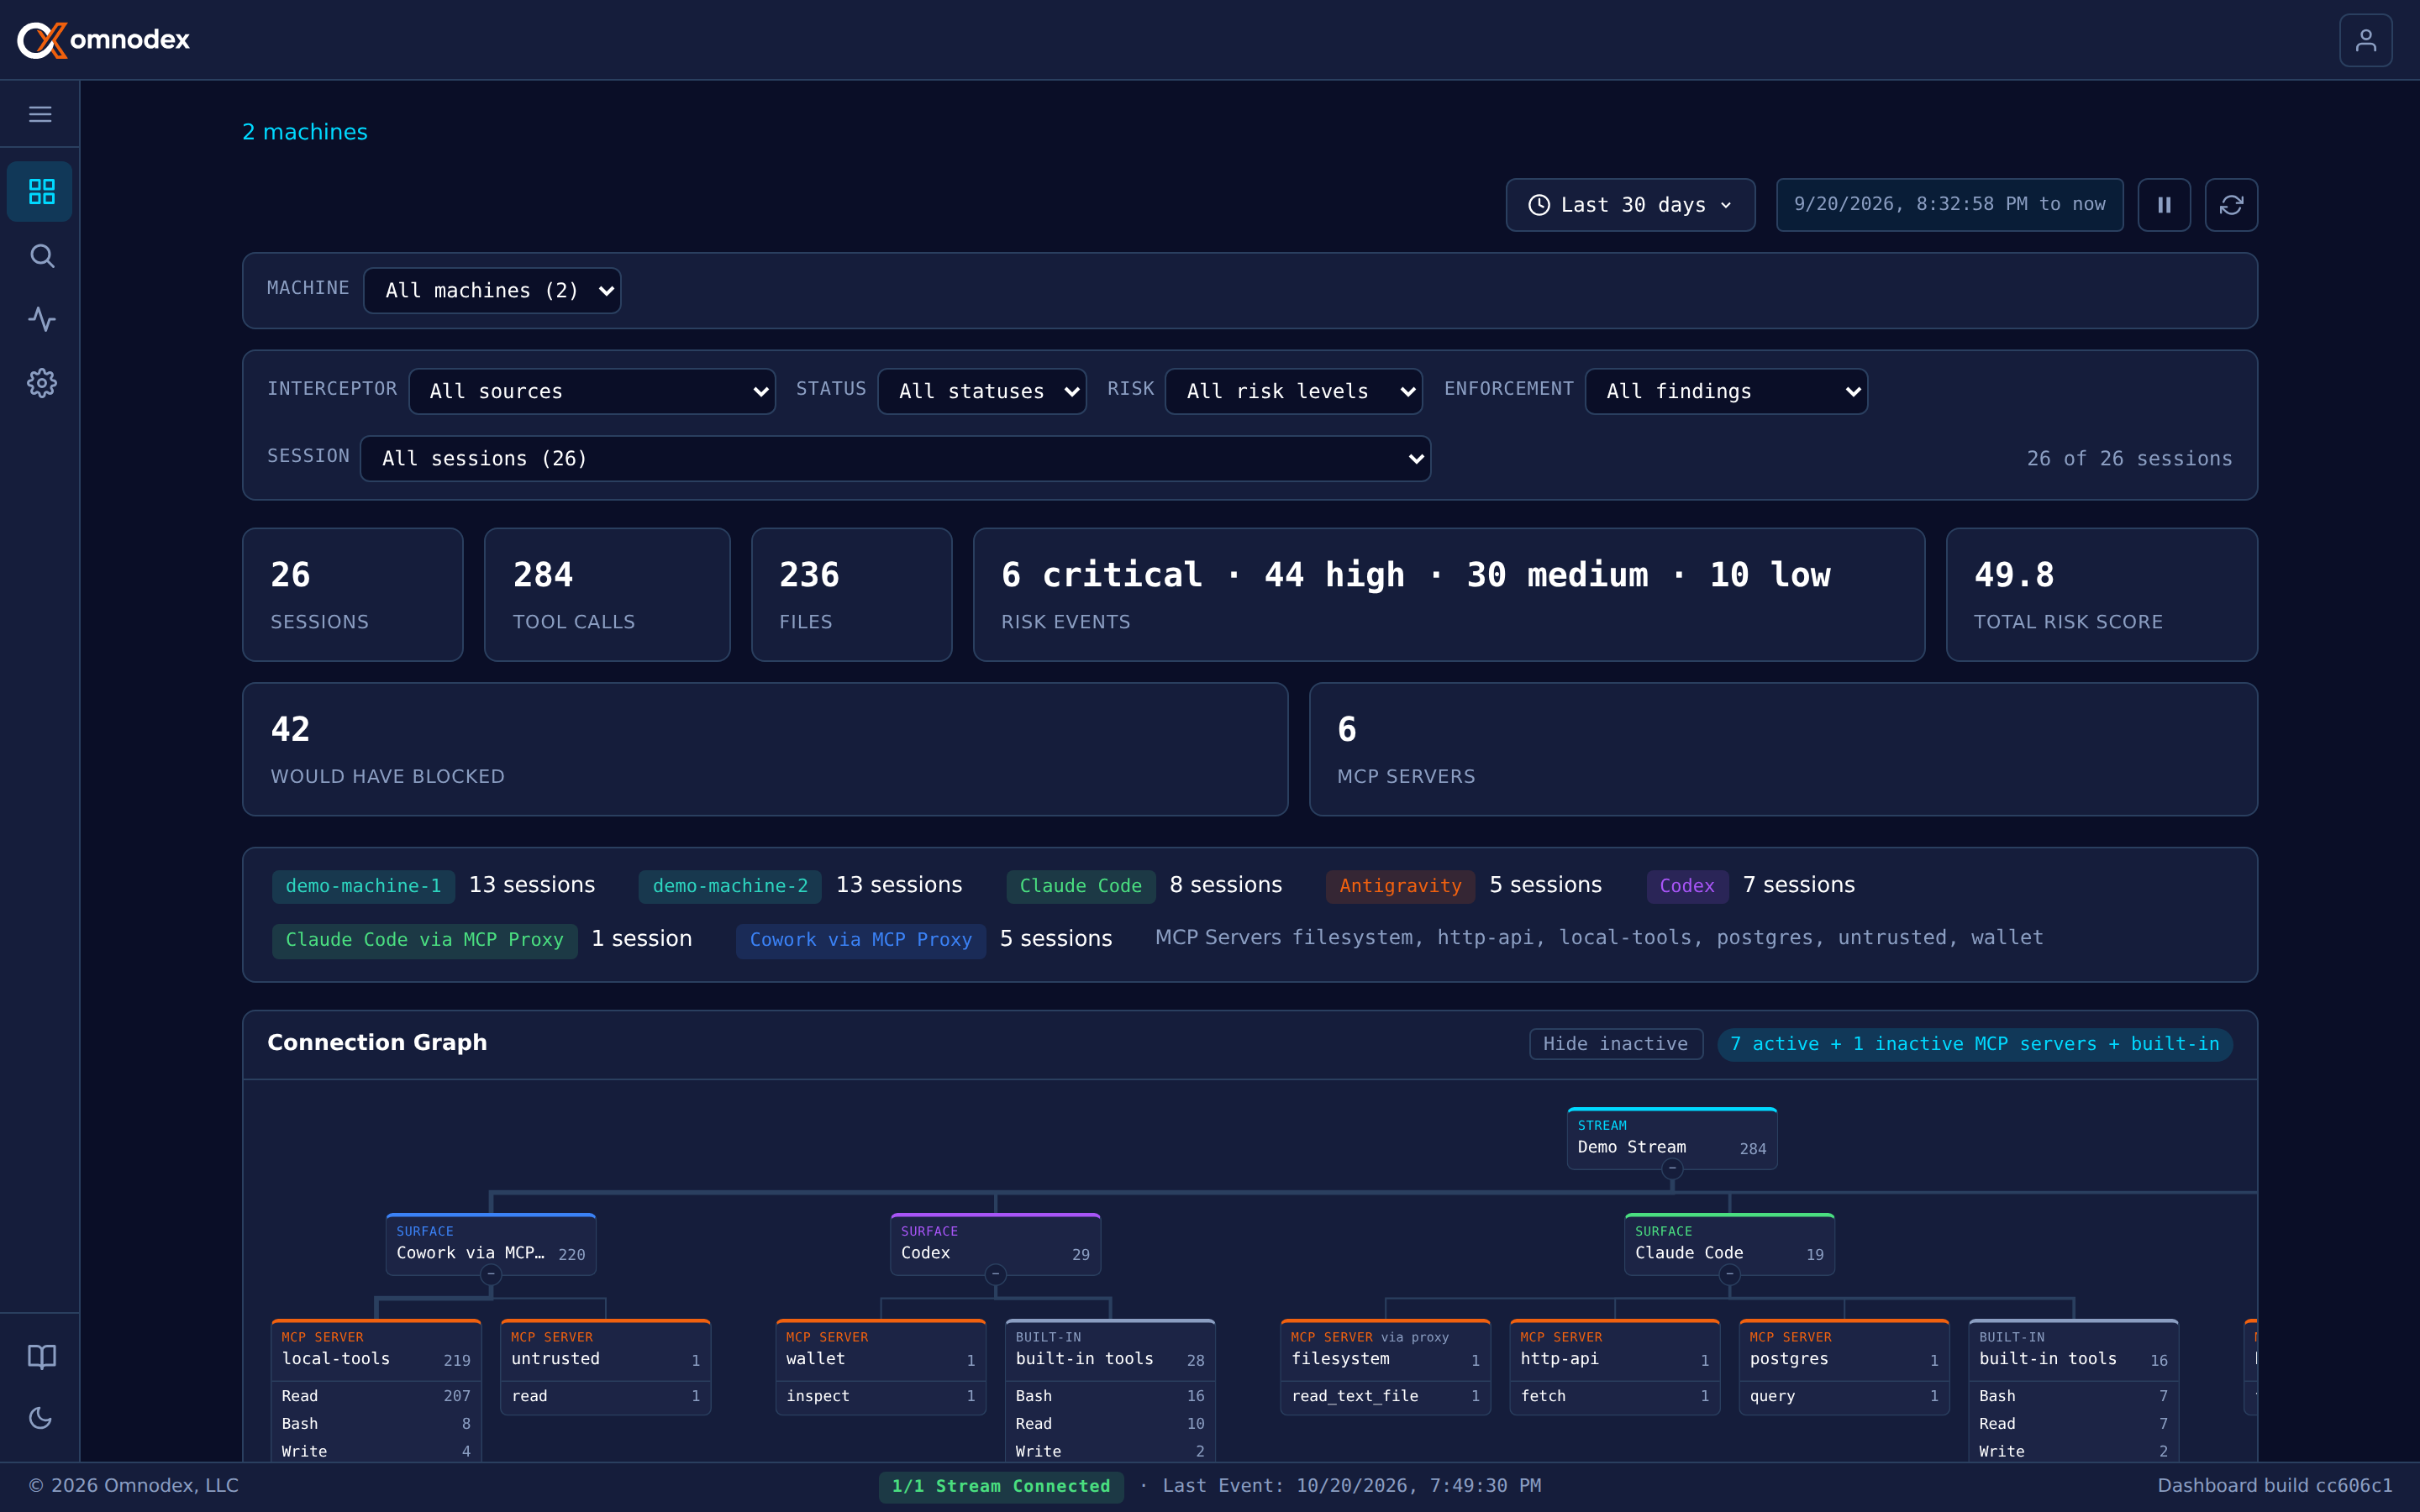
4. See your agents' activity
Every connected machine in one place, with filters, findings and their detail.


Step 3
Where to go next
Read the dashboards
What each panel shows, locally and hosted.
Review shadow mode
See what would have been stopped, before turning guardrails on.
Set up other agents
Codex, Antigravity and Cowork Desktop, step by step in the docs.
Read the documentation
Every command and setting, data handling, and the Risk Library.
Screenshots show generated demo data, not activity from a real user.